4.User Interface
4-1.Main UI
- The image below is the main UI of Octopus-toolkit
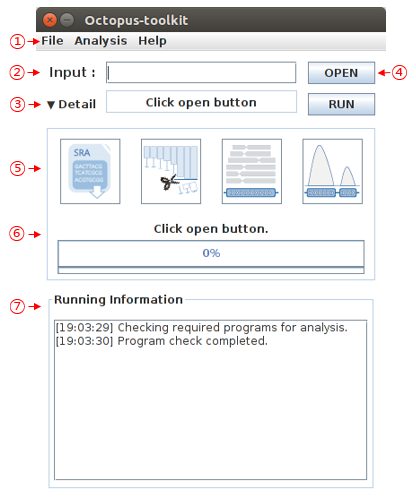
- The description of each part are as follows.
| No | Name | Description |
|---|---|---|
| 1 | Menu Bar |
Functions such as Private analysis (your data). |
| 2 | Input |
Input GEO accession number (GSE or GSM) or a text file containing GEO accession numbers (one GSE or GSM per line). |
| 3 | Status |
brief information regarding steps and errors. |
| 4 | Open and Run |
Run the anlaysis. |
| 5 | Full parameters |
Setting up the parameters for each tool. |
| 6 | Progress bar |
Progress bar. |
| 7 | Running information |
Status window |
4-3.Octopus Option
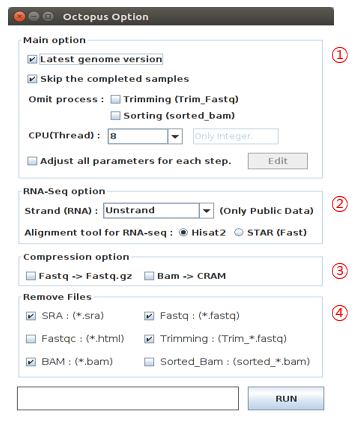
- Octopus-toolkit options
| No | Name | Description |
|---|---|---|
| 1 | Main option |
Main options. |
| 2 | RNA-Seq option |
Options for RNA-seq data only. |
| 3 | Compression option |
To save disk space. |
| 4 | Remove Files |
Delete selected intermediate files after each process. |
4-4.Full parameters
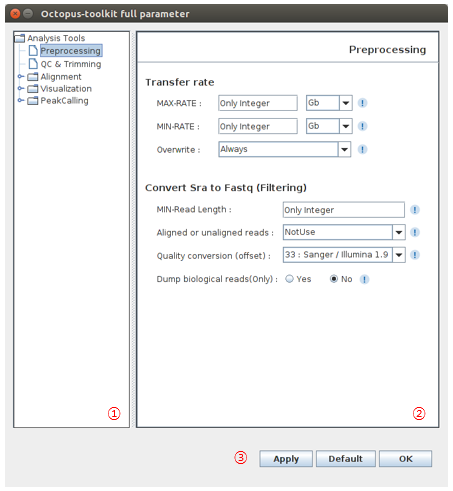
- The following image shows Full parameters window.
| No | Name | Description |
|---|---|---|
| 1 | Analysis tree |
Select one of steps |
| 2 | Paremeter window |
Change parameters for the process you selected |
| 3 | Apply |
You can apply or reset the option. |
4-5.Private Table
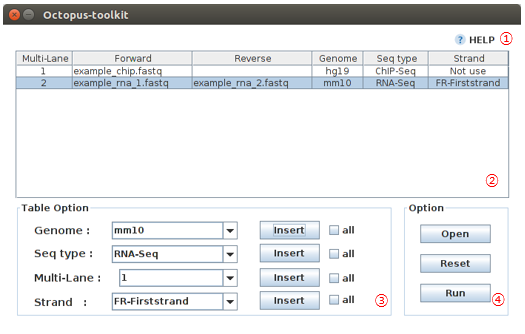
You can analyze your own data (Fastq) using Octopus-toolkit (Analysis - Private Data). The private Table is a setup window for your data.
To analyze your own data, you must select appropriate information as follows.
| No | Name | Description |
|---|---|---|
| 1 | Help |
Go to the tutorial page. |
| 2 | Private table |
Files with related information. |
| 3 | Setup |
The option window is used to set appropriate information needed for processing given files. |
| 4 | Apply |
You can apply or reset the option. |
4-6.Peak Calling Table
You can identify peaks using the Peak Calling function. You have to select appropriate options for each file from the setting window.
This function is not applicable for RNA-seq data.
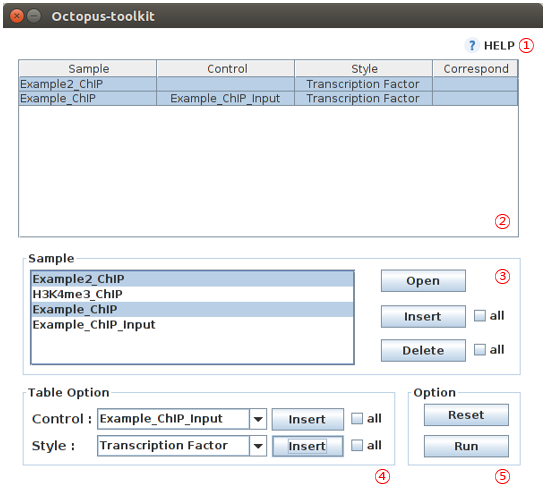
| No | Name | Description |
|---|---|---|
| 1 | Help |
Go to the tutorial. |
| 2 | Set up table |
Parameters for peak calling |
| 3 | Files |
Select files for analysis |
| 4 | Setup |
Select appropriate options for given files |
| 5 | Apply |
You can apply or reset the parameters |
4-7.Graph Table
To draw heatmap and line plots with the identified regions.
This function is not applicable for RNA-seq data.
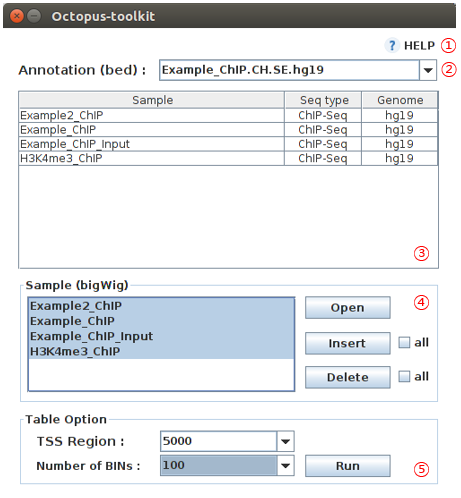
| No | Name | Description |
|---|---|---|
| 1 | Help |
Go to the tutorial. |
| 2 | Annotation |
Choose a peak file. |
| 3 | Samples |
Status window |
| 4 | Sample bigWig files |
Select bigWig files of samples you want to draw over the identified regions in the peak file. |
| 5 | Option |
Define the range (bp) relate to the center of peaks. |
4-8.IGV Table
You can visualize your data with bigWig files via IGV (IGV, Integrative Genomics Viewer).
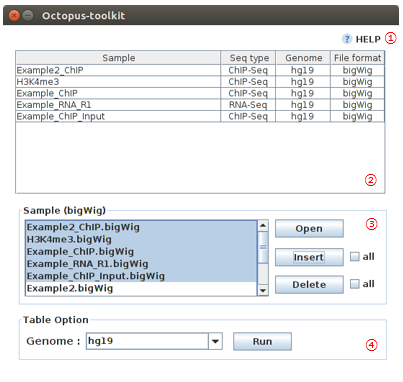
| No | Name | Description |
|---|---|---|
| 1 | Help |
Go to the tutorial. |
| 2 | Samples |
Status window. |
| 3 | Sample bigWig files |
Select bigWig files for visualization. |
| 4 | Genome |
Choose the reference genome. |